Hill Saturation
hill_saturation.RdA function to apply the Hill Saturation to a vector of media impressions
Examples
data(mmm_imps)
x <- mmm_imps$mi_banners
y <- hill_saturation(x, shape = 1)
y_scaled <- hill_saturation(x, shape = 1, max_ref = TRUE)
x[1:12]
#> [1] 0.000 3731.596 2217.981 0.000 4274.270 2801.566 3329.304 2652.199
#> [9] 3066.319 2415.696 0.000 0.000
y[1:12]
#> [1] 0.0000000 0.6087971 0.4805148 0.0000000 0.6406154 0.5388220 0.5813179
#> [8] 0.5251816 0.5611672 0.5018525 0.0000000 0.0000000
y_scaled[1:12]
#> [1] 0.000 2753.500 2173.298 0.000 2897.409 2437.013 2629.215 2375.319
#> [9] 2538.077 2269.805 0.000 0.000
plot(sort(x), sort(y), type = "p", main = 'Hill Saturated x (scaled to [0-1])')
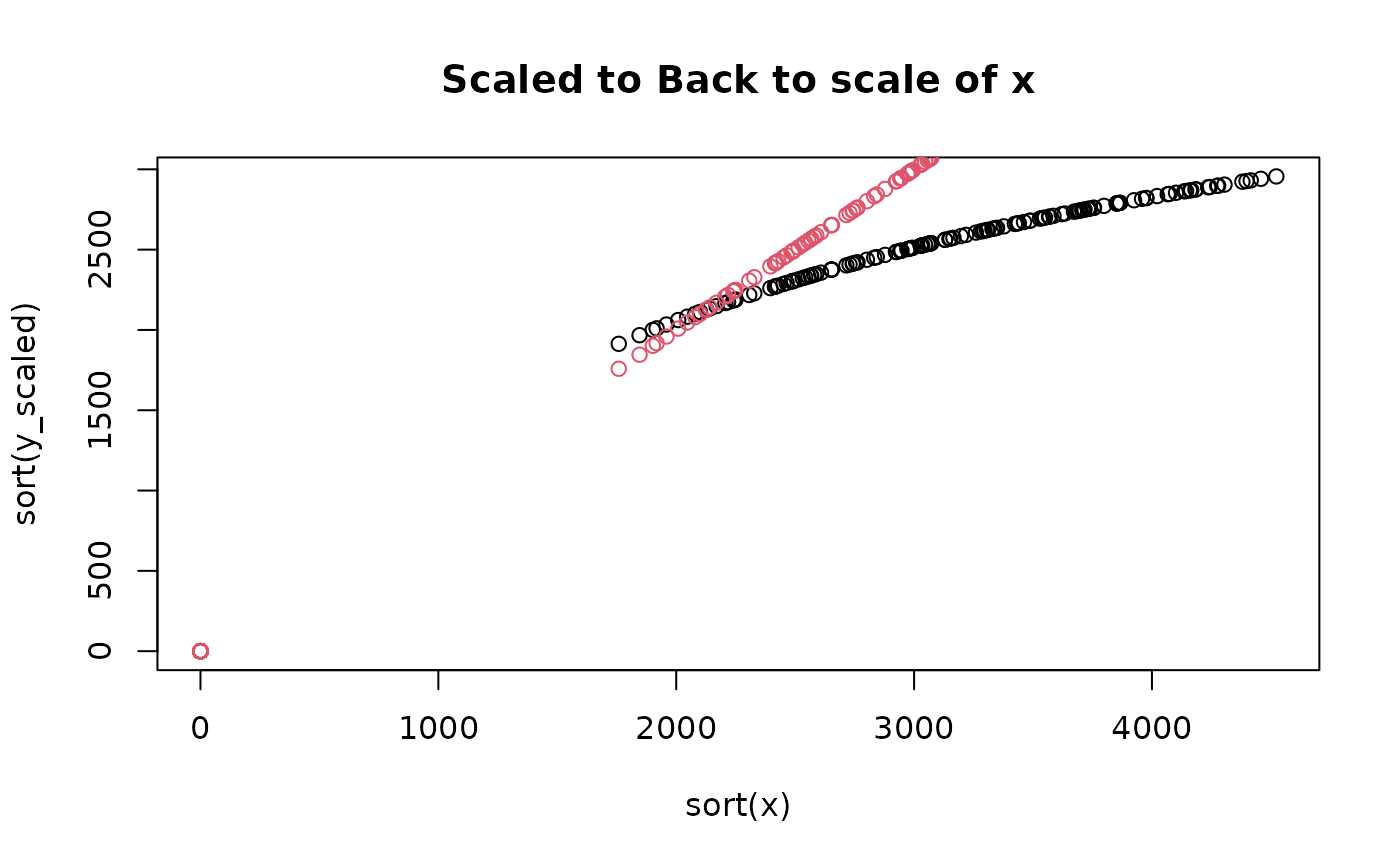
 plot(sort(x), sort(y_scaled), type="p", main = "Scaled to Back to scale of x")
points(sort(x), sort(x), col = 2)
plot(sort(x), sort(y_scaled), type="p", main = "Scaled to Back to scale of x")
points(sort(x), sort(x), col = 2)